July 30, 2011

Neolithic demographic transition

A podcast with the author.

Science 29 July 2011:
Vol. 333 no. 6042 pp. 560-561
DOI: 10.1126/science.1208880

When the World’s Population Took Off: The Springboard of the Neolithic Demographic Transition

Jean-Pierre Bocquet-Appel

Abstract

During the economic transition from foraging to farming, the signal of a major demographic shift can be observed in cemetery data of world archaeological sequences. This signal is characterized by an abrupt increase in the proportion of juvenile skeletons and is interpreted as the signature of a major demographic shift in human history, known as the Neolithic Demographic Transition (NDT). This expresses an increase in the input into the age pyramids of the corresponding living populations with an estimated increase in the total fertility rate of two births per woman. The unprecedented demographic masses that the NDT rapidly brought into play make this one of the fundamental structural processes of human history.

Link

July 29, 2011

Initial settlement of the Americas: recurrent gene flow with Asia

AJPA DOI: 10.1002/ajpa.21564

Evaluating microevolutionary models for the early settlement of the New World: The importance of recurrent gene flow with Asia

Soledad de Azevedo et al.

Abstract

Different scenarios attempting to describe the initial phases of the human dispersal from Asia into the New World have been proposed during the last two decades. However, some aspects concerning the population affinities among early and modern Asians and Native Americans remain controversial. Specifically, contradictory views based mainly on partial evidence such as skull morphology or molecular genetics have led to hypotheses such as the “Two Waves/Components” and “Single Wave” or “Out of Beringia” model, respectively. Alternatively, an integrative scenario considering both morphological and molecular variation has been proposed and named as the “Recurrent Gene Flow” hypothesis. This scenario considers a single origin for all the Native Americans, and local, within-continent evolution plus the persistence of contact among Circum-Arctic groups. Here we analyze 2D geometric morphometric data to evaluate the associations between observed craniometric distance matrix and different geographic design matrices reflecting distinct scenarios for the peopling of the New World using basic and partial Mantel tests. Additionally, we calculated the rate of morphological differentiation between Early and Late American samples under the different settlement scenarios and compared our findings to the predicted morphological differentiation under neutral conditions. Also, we incorporated in our analyses some variants of the classical Single Wave and Two Waves models as well as the Recurrent Gene Flow model. Our results suggest a better explanatory performance of the Recurrent Gene Flow model, and provide additional insights concerning affinities among Asian and Native American Circum-Arctic groups.

Link

July 28, 2011

Numerical supremacy of modern humans over Neandertals

I haven't read this paper yet, but, as I pointed out recently, the numerical superiority of a population A over another B does not necessarily mean that B went extinct; it could just as easily have been fully absorbed.

This paper refers to modern humans and late Neandertals in France, so it is not entirely relevant to modern-Neandertal admixture, which, if it occurred, must have taken place in Asia, to account for the relative uniformity of Neandertal admixture across Eurasians.

Nonetheless, if modern humans outnumbered Neandertals when that admixture did take place, then this would give us a way to estimate whether it was sporadic or commonplace. For example, a 4% Neandertal admixture and a 10:1 modern/Neandertal population ratio would suggest that about "half" the Neandertals were absorbed, and admixture was commonplace. If, on the other hand, the two species had similar population numbers during contact, then the low Neandertal admixture estimates are consistent with sporadic, uncommon admixture events.

Science 29 July 2011: Vol. 333 no. 6042 pp. 623-627 DOI: 10.1126/science.1206930

Tenfold Population Increase in Western Europe at the Neandertal–to–Modern Human Transition

Paul Mellars, Jennifer C. French

Abstract

European Neandertals were replaced by modern human populations from Africa ~40,000 years ago. Archaeological evidence from the best-documented region of Europe shows that during this replacement human populations increased by one order of magnitude, suggesting that numerical supremacy alone may have been a critical factor in facilitating this replacement.

Link

Slavonic origin of Sorbs (again)

Another recent related study on the origin of Sorbs.

BMC Genetics 2011, 12:67doi:10.1186/1471-2156-12-67

Population-genetic comparison of the Sorbian isolate population in Germany with the German KORA population using genome-wide SNP arrays

Arnd Gross et al.

Abstract (provisional)
Background
The Sorbs are an ethnic minority in Germany with putative genetic isolation, making the population interesting for disease mapping. A sample of N=977 Sorbs is currently analysed in several genome-wide meta-analyses. Since genetic differences between populations are a major confounding factor in genetic meta-analyses, we compare the Sorbs with the German outbred population of the KORA F3 study (N=1644) and other publically available European HapMap populations by population genetic means. We also aim to separate effects of over-sampling of families in the Sorbs sample from effects of genetic isolation and compare the power of genetic association studies between the samples.

Results
The degree of relatedness was significantly higher in the Sorbs. Principal components analysis revealed a west to east clustering of KORA individuals born in Germany, KORA individuals born in Poland or Czech Republic, Half-Sorbs (less than four Sorbian grandparents) and Full-Sorbs. The Sorbs cluster is nearest to the cluster of KORA individuals born in Poland. The number of rare SNPs is significantly higher in the Sorbs sample. FST between KORA and Sorbs is an order of magnitude higher than between different regions in Germany. Compared to the other populations, Sorbs show a higher proportion of individuals with runs of homozygosity between 2.5 Mb and 5 Mb. Linkage disequilibrium (LD) at longer range is also slightly increased but this has no effect on the power of association studies. Oversampling of families in the Sorbs sample causes detectable bias regarding higher FST values and higher LD but the effect is an order of magnitude smaller than the observed differences between KORA and Sorbs. Relatedness in the Sorbs also influenced the power of uncorrected association analyses.

Conclusions
Sorbs show signs of genetic isolation which cannot be explained by over-sampling of relatives, but the effects are moderate in size. The Slavonic origin of the Sorbs is still genetically detectable. Regarding LD structure, a clear advantage for genome-wide association studies cannot be deduced. The significant amount of cryptic relatedness in the Sorbs sample results in inflated variances of Beta-estimators which should be considered in genetic association analyses.

Link

July 26, 2011

DIY Dodecad

It's been more than 3 years that I started the non-commercial autosomal ancestry analysis field with the release of EURO-DNA-CALC. Today, I am releasing DIY Dodecad 1.0, the next generation of ancestry self-analysis.

Back in 2008, personal genome services using microarrays had just recently started, and it was a great opportunity to bring together the published data about human populations in the scientific literature with the new flood of data from customers of the new companies. I thought, that these were either underserved by the simple European-Asian-African model in the more reputable companies, or fed fairytales by the less reputable ones.

Of course, EURO-DNA-CALC was rudimentary by today's standards, as it used only a few hundred ancestry informative SNPs. Nonetheless, it did manage to be of some use before it was retired.

Almost a year ago, I decided to take up the mantle of genome blogger once again, with the goal of updating and improving EURO-DNA-CALC with the new wealth of population data that had since become available. Two reasons made me deviate from my original plan:
  • ADMIXTURE only runs on Linux or MacOS, while my favorite R is quite underpowered to do the job; hence, the vast majority of regular PC users would not/could not try a new tool that upped both the number of SNPs, and the number of ancestral populations substantially.
  • I realized the value of not only providing a tool to the community based on published data, but on collecting data myself; this would ensure that the tool would take into account several regions of the world that are "black holes" as far as publicly accessible data are concerned.
Thus began the Dodecad Ancestry Project, based on the idea of providing the community with results in exchange for data that could then create better results, and so on, in a virtuous circle.

Nonetheless, I always kept thinking of how I could encompass the Dodecad Project's main admixture analysis in a DIY tool; I explain the reasons why in my post introducing the new software, but they all boil down to one:

  • Interest in the Project has been huge, and I always felt bad when I had to turn down someone's relatives, or people of mixed ancestry, or the n-th member of a well-represented group. With all the automation in place, it still takes me a couple of minutes to process a sample, and the task of doing it myself for potentially thousands is daunting.

I learned that the hard way when I briefly opened submission to everybody; I had to close it in less than 12 hours, because of the overwhelming demand.

The new tool allows everyone to calculate their Dodecad v3 results. It did take me a few hours to write a couple hundred lines of code for it, but it will both make Dodecad analysis accessible to nearly everyone and save me a lot of time, some of which will, hopefully, be spent on experimenting with new interesting ideas for the Project beyond Clusters Galore, concordance ratios, zombies, the Dodecad Oracle, etc.

So, if you have a PC or Linux machine and 23andMe or Family Finder data, give it a try!

July 19, 2011

Eastern Mediterranean marker in Northeast Wales

If anyone knows what marker they're talking about, leave a comment. Here's the address of the event, so if anyone is in Wrexham or can get to it in a few hours and attends the talk, feel free to report back. From the event site:
Focusing on the history of the Wrexham area, the team are particularly keen to meet people with ancestry in north east Wales, Cheshire or Shropshire. There will also be an opportunity to contribute your own DNA sample to the project should you wish.
'Extraordinary' genetic make-up of north east Wales men
Experts are asking people from north east Wales to provide a DNA sample to discover why those from the area carry rare genetic make-up.

So far, 500 people have taken part in the study which shows 30% of men carry an unusual type of Y chromosome, compared to 1% of men elsewhere the UK.

Common in Mediterranean men, it was initially thought to suggest Bronze Age migrants 4,000 years ago.

...

Dr Grierson is leading the talk at Glyndŵr University on Tuesday and wants to speak to people with ancestry in the region to discover what is known about their family history - and to provide them with an opportunity to contribute a DNA sample to the project.

"The number of people in the north east Wales with this genetic makeup is quite extraordinary," he said.

"This type of genetic makeup is usually found in the eastern Mediterranean which made us think that there might have been strong connections between north east Wales and this part of Europe somewhere in the past.

"But this appears not to be the case, so we're still looking to find out why it's happened and what it reveals about the history of the region."

Climate-related variation of the human nasal cavity (Noback et al. 2011)

This paper has been sitting on my todo pile for quite a while now. It could very well be described as the most detailed study of human variation of the nose, nasal cavity, and nasopharynx that I've ever seen anywhere.

I don't know that I'm either competent or invested enough to give a full account of the paper, so I will limit myself to the conclusions:

Our study found significant correlations between nasal
cavity morphology as reflected by our dataset and both
temperature and vapor pressure variables. The bony
nasal cavity appears mostly associated with tempera-
ture, and the nasopharynx with humidity. Most impor-
tantly, nasal cavities from cold–dry climates are
relatively higher and narrower compared with those of
hot–humid climates, agreeing with previous findings on
the nasal aperture. The shape changes found are func-
tionally consistent with an increase in contact between
air and mucosal tissue in cold–dry climates by increase
of turbulence during inspiration and increase in surface-
to-volume ratio in the upper nasal cavity. However, the
observed shape differences are relatively modest and
show population overlap, which might indicate a compro-
mise morphology of the nasal cavity and/or the absence
of extreme adaptations that would reduce the versatility
of humans as generalists and a mobile species. Future
study including internal measurements and larger/more
diverse population samples will further refine our find-
ings and improve our understanding of the role of the
nasal cavity in modern human climate adaptation.
I had reviewed a similar paper on Neandertal nasal architecture in 2008 which aimed to solve the mystery of why Neandertals had broad noses despite living in a cold and dry environment. It might be a good idea to see how Neandertals would fit in the model presented by the authors in this paper.

American Journal of Physical Anthropology DOI: 10.1002/ajpa.21523

Climate-related variation of the human nasal cavity

Marlijn L. Noback

Abstract

The nasal cavity is essential for humidifying and warming the air before it reaches the sensitive lungs. Because humans inhabit environments that can be seen as extreme from the perspective of respiratory function, nasal cavity shape is expected to show climatic adaptation. This study examines the relationship between modern human variation in the morphology of the nasal cavity and the climatic factors of temperature and vapor pressure, and tests the hypothesis that within increasingly demanding environments (colder and drier), nasal cavities will show features that enhance turbulence and air-wall contact to improve conditioning of the air. We use three-dimensional geometric morphometrics methods and multivariate statistics to model and analyze the shape of the bony nasal cavity of 10 modern human population samples from five climatic groups. We report significant correlations between nasal cavity shape and climatic variables of both temperature and humidity. Variation in nasal cavity shape is correlated with a cline from cold–dry climates to hot–humid climates, with a separate temperature and vapor pressure effect. The bony nasal cavity appears mostly associated with temperature, and the nasopharynx with humidity. The observed climate-related shape changes are functionally consistent with an increase in contact between air and mucosal tissue in cold–dry climates through greater turbulence during inspiration and a higher surface-to-volume ratio in the upper nasal cavity.

Link

July 17, 2011

A good idea for a new project

I was a little disappointed because the excellent new paper by Li and Durbin had not included full genomes from Palaeoafrican individuals, as these are, perhaps, the most interesting ones in terms of the deep ancestry of our species.

I was then reminded, that a full genome of Khoisan individual (KB1) was, in fact, published by Schuster et al. in 2010, and both the paper and the genome are freely available online.

Why is this interesting? Consider the following figure from Schuster et al. (2010):

Notice that the African hunter-gatherer (KB1) has 1,704 private SNPs compared to a Yoruba (NA19240) and Archbishop Desmond Tutu (ABT), and 2,038 SNPs compared to a European American (J. C. Venter), and a Chinese (YH).

This amount of private variation admits to two explanations:
  1. Higher effective population size in Khoisan
  2. Deep population structure followed by admixture
As I have noted in my review of Li & Durbin (2011) UPDATE III, the effective mutation rate is in fact dependent on the effective population size, and it seems almost certain that a lower effective mutation rate must be used in a population of higher effective size.

There is no mystery why this is the case: accumulated genetic variation is a consequence of the mutation rate (how aggressively variation is introduced), and the effective population size (which controls how severely variation is lost due to drift).

A substantial difference in effective population size means that almost certainly the indiscriminate use of a single 2.5x10⁻⁸ mutation rate for different human populations is unwise.

This is a serious limitation, as far as I can tell, of the PMSC method introduced by Li & Durbin, as it assumes a single mutation rate parameter which is then used to estimate past population sizes.

In any case, it would be interesting to see how far back the divergence of the Khoisan individual from other humans will be, even if the 2.5x10⁻⁸ rate is employed, how large the Khoisan effective population will be, and also what antiquity of population substructure followed by admixture within Africa will be sufficient to "save the phenomena."

Another interesting observation is that the genealogical autosomal mutation rate in humans (1.1x10⁻⁸) is actually lower than the estimated evolutionary rate from human-chimpanzee divergence (2.5x10⁻⁸)

Nothing in evolutionary biology can account for such a discrepancy, I think, unless there is extreme balancing selection maintaining variation across the entire genome.

So, either:
  1. There is a serious flaw in the genealogical rate as estimated from 1000 Genomes trios, or
  2. We are about to find out that quite deep population structure and admixture played a role in the history of the genus Homo, deep in a sense of human-ape interbreeding after Homo-Pan speciation 7 million years ago, an idea that was proposed, for different reasons, a few years ago
Calibration of the mutation rate is, of course, quite important for correlating genetic with archaeological events.

For example, Li & Durbin propose that gene flow between Eurasians could have been effected during the Ice Age, as they retreated southwards; such a proposal is necessary to account for divergence between Europeans and East Asians of ~20ky, which is about half the earliest known colonization of Europe. Halving the mutation rate harmonizes the genetic divergence with archaeology, but would push the divergence of Eurasians from West Africans to the dawn of anatomical modernity, and African hunter-gatherer antiquity well beyond it.

I predict that the next few years will reignite many old debates in anthropology.

July 16, 2011

Craniofacial morphology in Austrian Early Bronze Age

J Anthropol Sci. 2011 Jul 1. [Epub ahead of print]

Craniofacial morphology in Austrian Early Bronze Age populations reflects sex-specific migration patterns.

Pellegrini A, Teschler-Nicola M, Bookstein F, Mitteroecker P.

Abstract
The Early Bronze Age (2.300-1.500 BC) in lower Austria consists of three synchronous regional manifestations (Únetice, Unterwölbling, and Wieselburg cultures). The bearers of these cultures inhabited a relatively small geographic area and shared similar ecological conditions, but previous studies revealed population differences in skeletal morphology. We analyzed the cranial morphology of 171 individuals of these populations with a geometric morphometric approach in order to compare different migration scenarios. We find significant mean form differences between populations and between sexes. In a principal component analysis, the Wieselburg population, located southwest of the Danube, largely separates from the Únetice population north of the Danube, whereas the southwestern Unterwölbling group, which played a central role in trading bronze objects, overlaps with both. The Böheimkirchen group, inhabiting the southwestern Danubian area in the later phase of the Early Bronze Age, differs from the chronologically older Unterwölbling group. Geographic distance between six sites and position relative to the river Danube accounted for 64% of form distance variation; the effect of the river Danube was considerably larger than hat of geographic distance per se. As predicted for a patrilocal system in which females have a larger marriage domain than males, we found that female mean forms are more similar to each other than male mean forms. Geographic conditions explained more than twice as much variation in females as in males, suggesting that female migration was more affected by geographical constraints than male migration was.

Link

July 13, 2011

Human population history from single human genomes (Li & Durbin 2011)

I will update this blog entry when I read the paper. In the meantime, see Nature News and New Scientist.

UPDATE I

From the supplementary material (p. 8):
The TMRCA estimated by the PSMC model is in the units of mutation per site. To rescale TMRCA in the units of years, we need to know the mutation rate per site per year, which can be estimated by using closely related species. Table S1 implies that in primates, the mutation rate is broadly around 10−9 per site per year, the rate we used in rescaling the PSMC estimate (we assumed a 2.5 × 10⁻⁸ mutation rate per site per generation and a 25-year generation time, which is translated to a 1.0 × 10⁻⁹ mutation rate per site per year).

However, recent direct measurement using whole genome sequences in pedigrees suggest that in the individuals examined the mutation rate per site per generation approaches 10−8 (Roach et al.,2010; 1000 Genomes Project Consortium, 2010), twice smaller than the rate we use. Nonetheless,what matters for population genetic based methods such as PSMC is the time average. A comparatively small fraction of higher mutation rates could change this average significantly. We therefore feel that although direct measurements are clearly valuable, there are not enough yet to change the mutation rates used in population genetic based analyses.
The mutation rate was an issue in another recent paper, which used a similar 2.36x10⁻⁸ rate as the one here, and not the much lower rate from a couple of 1000 Genomes family trios.

As I said in that post (and more recently), we clearly have a lot to learn about autosomal mutation rates yet, and hopefully we will both get a better estimate of the rate from more trios of the 1000 Genomes project, as well as establish possible population variation in that rate.

UPDATE II (Divergence of Europeans and East Asians):

From the supplementary material (p. 13):
On the other hand, several studies using nuclear DNA placed the East Asian-European divergence around 17–25kya (Keinan et al., 2007; Garrigan et al., 2007; Gutenkunst et al., 2009). Our PSMC estimate from the combined Venter and YH X chromosomes is also very recent (Figure S7d). This leads to the apparent inconsistency with the fossil evidence that anatomically modern human have spread across the continent by at least 40kya. One of the possible explanations is that during the Last Glacial Maximum at about 20kya, the non-African populations retreated southward (Forster, 2004), and gene flows may have occurred between the different populations again. Under this hypothesis, the recent gene flow between YRI.X and KOR.X would be reasonable, although autosomal data from more populations are needed to further confirm the existence of the recent gene flow.
Gravel et al. suggested that there may have been "ghost populations" intermediate between Europeans and East Asians that suppress their divergence times; the explanation of Li & Durbin is different, but of the same kind.

An easy reconciliation of the archaeological divergence times with the genetic evidence, would, of course, be immediately effected if the "slow" family-derived rate is adopted: this would double West/East Eurasian split time to about 40kya, but would also push back the split of West Africans from Eurasians to the dawn of anatomical modernity to more than 200kya, and, the African hunter-gatherers (not examined here) well into multiregional evolution time depths.

UPDATE III (Jul 14): (A chicken and egg problem)

The authors use a 2.5 × 10⁻⁸ mutation rate per site per generation and a 25-year generation time in the paper, citing Nachman and Crowell (2000).

Nachman and Crowell estimate this rate with a Chimpanze-Human divergence at 5 million years and an ancestral population size of 10,000. However, since their generation length is 20 years, their 5 million years become 6.25 million in 25-year generation terms; the authors of the current paper (Table S1) put the human-chimp divergence at 7 million years.

What is most interesting, is that the current paper estimates ancestral population sizes by fixing the mutation rate; whereas Nachman and Crowell (2000) estimated the mutation rate by making different assumptions about ancestral population size. For example, their rate of 2.5x10⁻⁸ assumes an ancestral population size of 10,000 whereas for an ancestral population size of 100,000, this becomes 1.5x10⁻⁸.
In other words, it's a chicken and egg problem: the mutation rate has been calibrated on assumptions about ancestral population size in the earlier paper; ancestral population size is estimated by using the mutation rate in the current one.

I really do think that the way forward is to get a better estimate of the mutation rate from actual parents and children, because I see no obvious way to go around the above-mentioned problem.


UPDATE IV (Jul 14): (Possible population structure)

From the paper:
All populations showed increased Ne between 60 and 200 kyr ago, about the time of origin of anatomically modern humans17. An alternative to an increase in actual population size during this time would be that there was population structure involving separation and admixture11,16 (Supplementary Fig 5).

In the supplement, the authors consider a split into two or three sub-populations at 250ky followed by admixture at 60ky. In such a scenario, the pattern of growth between 200ky and 60ky can be explained without any actual growth taking place: the apparent growth is due to the admixture event between different types of humans.

I would also add the difference between the apparent severity of the Eurasian bottleneck after 60ky (compared to Africans) may also be due to the continuation of admixture in Africa which keeps the apparent effective size high, whereas Eurasians now begin to move outside Africa, and no longer have the opportunity to mix with archaic Africans.

UPDATE V (Jul 14): It is extremely unfortunate that this type of research was not carried out on Native Americans, Native Australians, and African hunter-gatherers. All of these would provide useful insight:
  1. Native Americans, because they would be somewhat immune to "late" gene flow with Africans that is hypothesized to have affected even East Asians
  2. Native Australians of Papuans, because of their substantial hypothesized "Denisovan" admixture which ought to register as an episode of "higher effective population size" prior to the admixture event
  3. African hunter-gatherers, because they, more than anyone else, would push the limits of inference to the past.


Nature (2011) doi:10.1038/nature10231

Inference of human population history from individual whole-genome sequences

Heng Li & Richard Durbin

The history of human population size is important for understanding human evolution. Various studies1, 2, 3, 4, 5 have found evidence for a founder event (bottleneck) in East Asian and European populations, associated with the human dispersal out-of-Africa event around 60 thousand years (kyr) ago. However, these studies have had to assume simplified demographic models with few parameters, and they do not provide a precise date for the start and stop times of the bottleneck. Here, with fewer assumptions on population size changes, we present a more detailed history of human population sizes between approximately ten thousand and a million years ago, using the pairwise sequentially Markovian coalescent model applied to the complete diploid genome sequences of a Chinese male (YH)6, a Korean male (SJK)7, three European individuals (J. C. Venter8, NA12891 and NA12878 (ref. 9)) and two Yoruba males (NA18507 (ref. 10) and NA19239). We infer that European and Chinese populations had very similar population-size histories before 10–20 kyr ago. Both populations experienced a severe bottleneck 10–60 kyr ago, whereas African populations experienced a milder bottleneck from which they recovered earlier. All three populations have an elevated effective population size between 60 and 250 kyr ago, possibly due to population substructure11. We also infer that the differentiation of genetically modern humans may have started as early as 100–120 kyr ago12, but considerable genetic exchanges may still have occurred until 20–40 kyr ago.

Link

July 11, 2011

Site of Olympia buried by tsunami

Olympia Hypothesis: Tsunamis Buried the Cult Site On the Peloponnese
Olympia, site of the famous Temple of Zeus and original venue of the Olympic Games in ancient Greece, was presumably destroyed by repeated tsunamis that travelled considerable distances inland, and not by earthquake and river floods as has been assumed to date. Evidence in support of this new theory on the virtual disappearance of the ancient cult site on the Peloponnesian peninsula comes from Professor Dr Andreas Vött of the Institute of Geography of Johannes Gutenberg University Mainz, Germany.

...

"In earlier times, Olympia was not 22 kilometers away from the sea as it is today. Back then, the coastline was located eight or perhaps even more kilometers further inland," explains Vött. In his scenario, tsunamis came in from the sea and rushed into the narrow Alpheios River valley, into which the Kladeos River flows, forcing their way over the saddles behind which Olympia is located. The cult site was thus flooded. Vött assumes that the flooding decreased only slowly because the outflow of the Kladeos through the Alpheios valley was blocked by incoming tsunami waters and corresponding deposits. The analysis of the various layers of sediments in the Olympia area suggests that this scenario came true on several occasions during the last 7,000 years. It was during one of the more recent of these events in the 6th century AD that Olympia was finally destroyed and buried.

July 09, 2011

Afro-Indians in AJHG

Razib points me to a couple of new papers on the ancestry of Afro-Indians. The finding of admixture is not that interesting in itself; for example, I recently estimated the ancestry of 4 Siddis in the Reich et al. dataset as being 57.6% Sub-Saharan (Neo-African + Palaeo-African in Dodecad v3 parlance), which is quite close to the 58.7% estimated by Narang et al. on a different sample/marker set.

What is more interesting, is the attempt by Shah et al. to date the age of the admixture event to ~200 years ago. Note, however, that this estimate was done using ROLLOFF, which produces about half the age as HAPMIX and StepPCO, two other methods of using linkage disequilibrium to date admixture events.

Also, given that ROLLOFF and HAPMIX were done by some of the same people, the discrepancy requires an explanation. The availability of ROLLOFF was mentioned in the Moorjani et al. paper which introduced it, and I am told that a version of it will eventually be released.

It would be a good idea to attempt to explain the ROLLOFF/HAPMIX/StepPCO discrepancy, otherwise, I fear that LD-based age estimation will suffer the fate of Y-STR based age estimation for Y-chromosomes, with two incompatible methods persisting in the literature for years to come.

It seems that there is no shortage of factor of 2+ age discrepancies in the genetics literature no matter where you look, which is often underappreciated by the consumers of the genetic studies.

Anish M. Shah et al. Indian Siddis: African Descendants with Indian Admixture
Link
Ankita Narang et al. Recent Admixture in an Indian Population of African Ancestry Link

July 08, 2011

Co-evolution of belligerence and bravery

PLoS ONE 6(7): e21437. doi:10.1371/journal.pone.0021437

The Demographic Benefits of Belligerence and Bravery: Defeated Group Repopulation or Victorious Group Size Expansion?

Laurent Lehmann

Intraspecific coalitional aggression between groups of individuals is a widespread trait in the animal world. It occurs in invertebrates and vertebrates, and is prevalent in humans. What are the conditions under which coalitional aggression evolves in natural populations? In this article, I develop a mathematical model delineating conditions where natural selection can favor the coevolution of belligerence and bravery between small-scale societies. Belligerence increases an actor's group probability of trying to conquer another group and bravery increase the actors's group probability of defeating an attacked group. The model takes into account two different types of demographic scenarios that may lead to the coevolution of belligerence and bravery. Under the first, the fitness benefits driving the coevolution of belligerence and bravery come through the repopulation of defeated groups by fission of victorious ones. Under the second demographic scenario, the fitness benefits come through a temporary increase in the local carrying capacity of victorious groups, after transfer of resources from defeated groups to victorious ones. The analysis of the model suggests that the selective pressures on belligerence and bravery are stronger when defeated groups can be repopulated by victorious ones. The analysis also suggests that, depending on the shape of the contest success function, costly bravery can evolve in groups of any size.

Link

July 06, 2011

Little rare allele sharing between human populations + demographic history estimates

The failure of the common disease common variant paradigm has led to an effort to identify rare variants that may contribute to disease in human populations. To identify such rare variants, one needs to look at more individuals at denser genomic coverage. This has been one of the inspirations of the 1000 Genomes project, which aims to capture full genome sequences of more than the 1,000 individuals of its title.

A new paper has identified an important property of rare variants: they tend to be population-specific: rare variants in Europeans are mostly not the same as rare variants in Asians or Africans. A corollary of this observation is that a sample of X global individuals is effectively much smaller than X for the purposes of identifying rare variants: you expect 1 in 1,000 individuals to possess an allele with 0.1% frequency, but if the allele occurs at 0.1% frequency in 250 Europeans, and at 0% frequency in 750 non-Europeans, then you expect to find 0.25 individuals in such a sample, in other words, you are very likely to miss it entirely.

The practical consequence of this, is to identify most rare variants in humans you need even larger samples: the 1000 genomes project is likely to miss many of them, and, correspondingly, a large part of the potential contribution of rare variants to disease. A second consequence is that if the so-called missing heritability is hiding in rare variants, different populations will get the same diseases but for different genomic reasons.

Was this unexpected?

This finding was not entirely unexpected. Consider the human species prior to its separation: it would harbor alleles ranging from very low to very high frequencies.

The very low-frequency alleles would have a high probability of being lost by drift in both the entire species (hence becoming irrelevant), or by founder effect in most human sub-populations. Only those that had some selective advantage might be expected to rise in frequency. Consequently, low-frequency alleles prior to the separation of Homo sapiens into regional sub-populations would mostly not persevere as low-frequency alleles today.

How about very low frequency alleles that arose after the separation of modern humans into Africans, Asians, Europeans, etc.? Again, the odds are stacked against those moving around: with a low migration rate between different human groups, it is fairly unlikely that a rare allele would migrate. Consequently, rare alleles that arose in regional populations were either lost by drift, or they grew in frequency (becoming non-rare), and, if, they persevered as rare variants, it is unlikely that they would be exchanged with other regional populations.

So, where do the rare variants mostly come from? They have to be mostly recent variants that have not had the time to either go extinct due, or to become common by drift, and their rarity and young age makes it unlikely that they had the chance to emigrate to other regional populations.

Demographic estimates

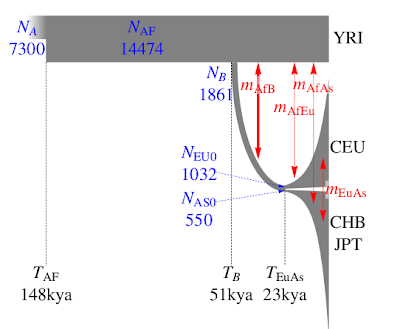
The paper's other major contribution is in providing some fairly tight estimates of human demographic parameters, much better than previous ones. A summary can be seen on the left. What I especially like about this is that the authors explicitly tackle the very young age for the European-East Asian split, without invoking a "long hiatus" as previous papers did. Here is their explanation:
The narrow confidence intervals on some of the parameters should not obscure the fact that the parameter estimates are model-dependent. As a simple example, a model that does not allow for migration would require more recent split times to produce similar levels of population divergence. The demographic history of the four populations considered is much more eventful than what is accounted for by our model. Additional geographically intermediate populations from the Near East and Central Asia that were not included in our analysis might contribute significantly to the allele frequency distribution as ghost populations (19).Incorporating an appropriate number of source populations for estimates of migration has been a general limitation of two-and three-population models under isolation migration coalescent, approximate Bayesian computation, and diffusion-based approaches. This limitation might explain why our estimate of the divergence between East Asians and Europeans is more recent than estimates based on archaeological evidence (18), but is comparable with estimates of 23 kya (20) under an approximate Bayesian computation approach and 25 kya under an isolation migration approach with mtDNA X and Y sequence data (21).


This makes excellent sense: we don't need to hypothesize that Proto-Eurasians spent tens of thousands of years in the Near East in a long stasis for no apparent reason; the archaeological record shows the arrival of anatomically modern humans in Europe long before 23,000 years ago. Indeed the earliest Europeans, and certainly those of 23,000 years ago already had typical Caucasoid physical characteristics. Hence, the idea that Europeans' ancestors were still marooned as undifferentiated Eurasians together with the ancestors of the Chinese difficult to swallow.

Instead, we can accept that East-West Eurasian differentiation began already shortly after Out-of-Africa, and the younger apparent divergence of Europeans and East Asians is due to gene flow, perhaps from an unsampled population that contributed genes to both.

Another interesting observation in the paper is that the divergence between Yoruba and Eurasians is a likely under-estimate of the Out-of-Africa event. This makes excellent sense, as West Africans are not expected to be identical with Proto-Eurasians or their closest African relatives. Hence, the 51ky is an over-estimate, and the true age seems to correspond well with the appearance of fully modern (in both appearance and behavior) Upper Paleolithic people in Eurasia, in full agreement with the recent scenario I posted on the blog, the end of Marine Isotope Stage 3, and the coalescence of most modern human Y-chromosomes.

Indeed, even the age of the African population (148kya) seems to be consistent with the recent re-dating of Y-chromosome Adam to 142kya. It would be interesting to include some African hunter-gatherers in the future; unfortunately, one of the great defects of the 1000 Genomes Project is its lack of African hunter-gatherers, which are, perhaps the most interesting populations for human origins research.

In any case, it is refreshing to see a genetics paper that tries to show how the genetic dates may deviate from the archaeological ones for good internal reasons, and seeks to explain the small discrepancies between the two by the limitations of genetic methods. This is much better than proposing archaeological implausible scenaria to "save" the genetic evidence, which, until this paper came along, did not really have the fairly tight confidence intervals necessary for genetic-archaeological correlations.

PNAS doi: 10.1073/pnas.1019276108

Demographic history and rare allele sharing among human populations

Simon Gravel et al.

High-throughput sequencing technology enables population-level surveys of human genomic variation. Here, we examine the joint allele frequency distributions across continental human populations and present an approach for combining complementary aspects of whole-genome, low-coverage data and targeted high-coverage data. We apply this approach to data generated by the pilot phase of the Thousand Genomes Project, including whole-genome 2–4× coverage data for 179 samples from HapMap European, Asian, and African panels as well as high-coverage target sequencing of the exons of 800 genes from 697 individuals in seven populations. We use the site frequency spectra obtained from these data to infer demographic parameters for an Out-of-Africa model for populations of African, European, and Asian descent and to predict, by a jackknife-based approach, the amount of genetic diversity that will be discovered as sample sizes are increased. We predict that the number of discovered nonsynonymous coding variants will reach 100,000 in each population after ∼1,000 sequenced chromosomes per population, whereas ∼2,500 chromosomes will be needed for the same number of synonymous variants. Beyond this point, the number of segregating sites in the European and Asian panel populations is expected to overcome that of the African panel because of faster recent population growth. Overall, we find that the majority of human genomic variable sites are rare and exhibit little sharing among diverged populations. Our results emphasize that replication of disease association for specific rare genetic variants across diverged populations must overcome both reduced statistical power because of rarity and higher population divergence.

Link

Marital distance and height of children

AJPA DOI: 10.1002/ajpa.21482

Isolation by distance between spouses and its effect on children's growth in height

Sławomir Kozieł et al.

Heterosis is thought to be an important contributor to human growth and development. Marital distance (distance between parental birthplaces) is commonly considered as a factor favoring the occurrence of heterosis and can be used as a proximate measure of its level. The aim of this study is to assess the net effect of expected heterosis resulting from marital migration on the height of offspring, controlling for midparental height and socioeconomic status (SES). Height measurements on 2,675 boys and 2,603 girls ages 6 to 18 years from Ostrowiec Świętokrzyski, Poland were analyzed along with sociodemographic data from their parents. Midparental height was calculated as the average of the reported heights of the parents. Analyses revealed that marital distance, midparental height, and SES had a significant effect on height in boys and girls. The net effect of marital distance was much more marked in boys than girls, whereas other factors showed comparable effects. Marital distance appears to be an independent and important factor influencing the height of offspring. According to the “isolation by distance” hypothesis, greater distance between parental birthplaces may increase heterozygosity, potentially promoting heterosis. We propose that these conditions may result in reduced metabolic costs of growth among the heterozygous individuals.

Link

The origin of monogamy podcast

A podcast with Laura Fortunato.
Fortunato, who spoke with Michael Haederle last year about the agricultural roots of monogamy, talks about a recent study of hers, published in the journal Human Biology, where she used current patterns of language and marriage to determine when monogamous marriage got rolling for Europe and much of Asia.

It turns out that this kind of marriage is much older than anyone had thought, beginning 8,000 to 9,500 years ago in what is now Turkey. And monogamy likely established itself for a very modern reason: to avoid headaches with inheritance.

I had mentioned her article on Proto-Indo-European monogamy recently.

July 01, 2011

Y chromosomes from Afghanistan

Someone from dna-forums was kind enough to send me the haplogroup estimates for this collection of haplotypes; the modal haplogroup in both North and South Afghanistan seems to be R1a with estimates ages that are consistent with those of the Underhill et al. study. (in "evolutionary mutation rate" years/25 years per genration: 12ky south, 7.8ky north, corresponding to 4.7/3ky using germline rate, correction factor, and 31.5 years/generation). I repeat what I wrote in the forum:
While I don't put much faith in Y-STR estimates due to the huge confidence intervals associated with them once all sources of uncertainty are factored in, these are comparable to the Underhill ones, and they seem to establish that (a) Afghanistan is not really remarkable in terms of Y-STR variation, (B) R1a (or at least the likely R1a1a forming the bulk of these) is a Neolithic-to-Bronze Age phenomenon, and (c) if the North/South difference is real, then it fits well with the highest estimated age in India-Pakistan-Nepal and a diminution towards Central Asia.
It would be great to see a study of Afghans with a detailed suite of Y-SNP markers to see how they fit in the Eurasian landscape. Hopefully a combination of more phylogenetic resolution and ancient DNA will help us better understand the ancient distribution and dispersals of the R1a haplogroup.

Somewhat related: some thoughts on Indo-Iranians.

Legal Medicine Volume 13, Issue 2, Pages 103-108 (March 2011)

Y-STR profiling in two Afghanistan populations

Harlette Lacauab et al.

Abstract

Afghanistan’s unique geostrategic position in Eurasia has historically attracted commerce, conflict and conquest to the region. It was also an important stop along the Silk Road, connecting the far eastern civilizations with the western world. Nevertheless, limited genetic studies have been performed in Afghan populations. In this study, 17 Y-chromosomal short tandem repeat (Y-STR) loci were typed to evaluate their forensic and population genetic applications in 189 unrelated Afghan males geographically partitioned along the Hindu Kush Mountain range into north (N=44) and south (N=145) populations. North Afghanistan (0.9734, 0.9905) exhibits higher haplotype diversity than south Afghanistan (0.9408, 0.9813) at both the minimal 9-loci and 17-loci Yfiler haplotypes, respectively. The overall haplotype diversity for both Afghan populations at 17 Y-STR loci is 0.9850 and the corresponding value for the minimal 9-loci haplotypes is 0.9487. A query using of the most frequent Afghan Yfiler haplotype (7.98%) against the worldwide Y-STR haplotype reference database (YHRD) returned no profile match, indicating a high power of discrimination with 17 Y-STR loci. A median-joining network based on 15 Y-STR loci displays limited haplotype sharing between the two Afghan populations, possibly due to the Hindu Kush Mountain range serving as a natural barrier to gene flow between the two regions.

Link