Three M5a (South Asian) and one C (Asian) mtDNA sequences were found in this sample of 319 Northern Greeks.
International Journal of Legal Medicine
DOI: 10.1007/s00414-007-0173-7
Mitochondrial control region sequences from northern Greece and Greek Cypriots
Jodi Irwin et al.
Abstract Entire mitochondrial control region data were generated for population samples of 319 unrelated individuals from northern Greece and 91 unrelated individuals from Cyprus. The samples from northern Greece have been previously typed for 15 nuclear short tandem repeat (STR; Kovatsi et al., Forensic Sci. Int. 159:61–63, 2006).
Electronic supplementary material The online version of this article (doi:10.1007/s00414-007-0173-7) contains supplementary material, which is available to authorized users.
Link

January 30, 2008
January 28, 2008
Human eye color news

From the first paper, the frequency of HERC2 rs916977 superimposed on an iris color map (sadly taken from a 1965 reference):
The American Journal of Human Genetics,
doi:10.1016/j.ajhg.2007.10.003
Three Genome-wide Association Studies and a Linkage Analysis Identify HERC2 as a Human Iris Color Gene
Manfred Kayser et al.
Abstract
Human iris color was one of the first traits for which Mendelian segregation was established. To date, the genetics of iris color is still not fully understood and is of interest, particularly in view of forensic applications. In three independent genome-wide association (GWA) studies of a total of 1406 persons and a genome-wide linkage study of 1292 relatives, all from the Netherlands, we found that the 15q13.1 region is the predominant region involved in human iris color. There were no other regions showing consistent genome-wide evidence for association and linkage to iris color. Single nucleotide polymorphisms (SNPs) in the HERC2 gene and, to a lesser extent, in the neighboring OCA2 gene were independently associated to iris color variation. OCA2 has been implicated in iris color previously. A replication study within two populations confirmed that the HERC2 gene is a new and significant determinant of human iris color variation, in addition to OCA2. Furthermore, HERC2 rs916977 showed a clinal allele distribution across 23 European populations, which was significantly correlated to iris color variation. We suggest that genetic variants regulating expression of the OCA2 gene exist in the HERC2 gene or, alternatively, within the 11.7 kb of sequence between OCA2 and HERC2, and that most iris color variation in Europeans is explained by those two genes. Testing markers in the HERC2-OCA2 region may be useful in forensic applications to predict eye color phenotypes of unknown persons of European genetic origin.
Link
The American Journal of Human Genetics,
doi:10.1016/j.ajhg.2007.11.005
A Single SNP in an Evolutionary Conserved Region within Intron 86 of the HERC2 Gene Determines Human Blue-Brown Eye Color
Richard A. Sturm et al.
Abstract
We have previously demonstrated that haplotypes of three single nucleotide polymorphisms (SNPs) within the first intron of the OCA2 gene are extremely strongly associated with variation in human eye color. In the present work, we describe additional fine association mapping of eye color SNPs in the intergenic region upstream of OCA2 and within the neighboring HERC2 (hect domain and RLD2) gene. We screened an additional 92 SNPs in 300–3000 European individuals and found that a single SNP in intron 86 of HERC2, rs12913832, predicted eye color significantly better (ordinal logistic regression R2 = 0.68, association LOD = 444) than our previous best OCA2 haplotype. Comparison of sequence alignments of multiple species showed that this SNP lies in the center of a short highly conserved sequence and that the blue-eye-associated allele (frequency 78%) breaks up this conserved sequence, part of which forms a consensus binding site for the helicase-like transcription factor (HLTF). We were also able to demonstrate the OCA2 R419Q, rs1800407, coding SNP acts as a penetrance modifier of this new HERC2 SNP for eye color, and somewhat independently, of melanoma risk. We conclude that the conserved region around rs12913832 represents a regulatory region controlling constitutive expression of OCA2 and that the C allele at rs12913832 leads to decreased expression of OCA2, particularly within iris melanocytes, which we postulate to be the ultimate cause of blue eye color.
Link
January 24, 2008
Genetic structure of Pacific Islanders
A very interesting freely available article. See also this recent blog post, Polynesians more Asian than Melanesian. Like previous studies on e.g., Europeans, European Americans, Native Americans, Indians, the scientific study of humanity by grouping individuals in clusters (i.e., races and subraces) is leading the way for a deeper understanding of the origins of the world's populations and ethnic groups.
PLoS Genetics Vol. 4, No. 1, e19 doi:10.1371/journal.pgen.0040019
The Genetic Structure of Pacific Islanders
Jonathan S. Friedlaender et al.
Human genetic diversity in the Pacific has not been adequately sampled, particularly in Melanesia. As a result, population relationships there have been open to debate. A genome scan of autosomal markers (687 microsatellites and 203 insertions/deletions) on 952 individuals from 41 Pacific populations now provides the basis for understanding the remarkable nature of Melanesian variation, and for a more accurate comparison of these Pacific populations with previously studied groups from other regions. It also shows how textured human population variation can be in particular circumstances. Genetic diversity within individual Pacific populations is shown to be very low, while differentiation among Melanesian groups is high. Melanesian differentiation varies not only between islands, but also by island size and topographical complexity. The greatest distinctions are among the isolated groups in large island interiors, which are also the most internally homogeneous. The pattern loosely tracks language distinctions. Papuan-speaking groups are the most differentiated, and Austronesian or Oceanic-speaking groups, which tend to live along the coastlines, are more intermixed. A small “Austronesian” genetic signature (always <20%) was detected in less than half the Melanesian groups that speak Austronesian languages, and is entirely lacking in Papuan-speaking groups. Although the Polynesians are also distinctive, they tend to cluster with Micronesians, Taiwan Aborigines, and East Asians, and not Melanesians. These findings contribute to a resolution to the debates over Polynesian origins and their past interactions with Melanesians. With regard to genetics, the earlier studies had heavily relied on the evidence from single locus mitochondrial DNA or Y chromosome variation. Neither of these provided an unequivocal signal of phylogenetic relations or population intermixture proportions in the Pacific. Our analysis indicates the ancestors of Polynesians moved through Melanesia relatively rapidly and only intermixed to a very modest degree with the indigenous populations there.
Link
North vs. South differences in China detectable in mtDNA but not in Y chromosomes
European Journal of Human Genetics advance online publication 23 January 2008; doi: 10.1038/sj.ejhg.5201998
A spatial analysis of genetic structure of human populations in China reveals distinct difference between maternal and paternal lineages
Fuzhong Xue et al.
Analyses of archeological, anatomical, linguistic, and genetic data suggested consistently the presence of a significant boundary between the populations of north and south in China. However, the exact location and the strength of this boundary have remained controversial. In this study, we systematically explored the spatial genetic structure and the boundary of north–south division of human populations using mtDNA data in 91 populations and Y-chromosome data in 143 populations. Our results highlight a distinct difference between spatial genetic structures of maternal and paternal lineages. A substantial genetic differentiation between northern and southern populations is the characteristic of maternal structure, with a significant uninterrupted genetic boundary extending approximately along the Huai River and Qin Mountains north to Yangtze River. On the paternal side, however, no obvious genetic differentiation between northern and southern populations is revealed.
Link
January 22, 2008
Y chromosomes of Bakhtiari and Arabs from Iran
An interesting observation regarding haplogroups J2 and G in Indo-European and Semitic-speaking Iranians:
This is an interesting observation which is inline with my previous suggestion about the presence of haplogroup J2 in early Indo-Aryan speakers, and which suggests that this haplogroup is not of recent Semitic origin in Iranian speakers.
A quite peculiar conclusion from the paper:
One has to wonder how "extreme mixing" is compatible with "very little sharing of Y-STR haplotypes between Iranian Arabs and other groups from Iran" for Y-haplogroups J2 and G.
Annals of Human Genetics (OnlineEarly Articles).
doi:10.1111/j.1469-1809.2007.00413.x
Close Genetic Relationship Between Semitic-speaking and Indo-European-speaking Groups in Iran
I. Nasidze et al.
Haplogroup J2*(M172) was found in relatively high frequencies in the Iranian Arab and Bakhtiari groups, as well as in other groups from Iran. Haplogroup G* (M201) was found with similar frequency in Iranian Arabs as in the Iranian groups from Tehran and Isfahan, but in higher frequency in the Bakhtiari, as with the Mazandarani and Gilaki groups from Iran (Nasidze et al., 2004, 2006). To further investigate the relationships of these groups based on these two Y-SNP haplogroups, we typed nine Y-STR loci in individuals with these two Y-SNP haplogroups. Median networks of the Y-STR haplotypes are shown in Figure 5. For both Y-SNP haplogroups, the Bakhtiari are more similar to other Iranian groups than to the Iranian Arabs. Moreover, there is very little sharing of Y-STR haplotypes between Iranian Arabs and other groups from Iran, in contrast to the situation with mtDNA HV1 sequences.
This is an interesting observation which is inline with my previous suggestion about the presence of haplogroup J2 in early Indo-Aryan speakers, and which suggests that this haplogroup is not of recent Semitic origin in Iranian speakers.
A quite peculiar conclusion from the paper:
This case adds to our previous studies that have attempted to disentangle the relative influence of geography and language on the genetic relationships of groups whose geographic neighbors are different from their linguistic neighbors. Some general patterns are beginning to emerge from these studies of linguistic enclaves. One pattern is that observed in the present study, namely extensive mixing of groups speaking different languages.
One has to wonder how "extreme mixing" is compatible with "very little sharing of Y-STR haplotypes between Iranian Arabs and other groups from Iran" for Y-haplogroups J2 and G.
Annals of Human Genetics (OnlineEarly Articles).
doi:10.1111/j.1469-1809.2007.00413.x
Close Genetic Relationship Between Semitic-speaking and Indo-European-speaking Groups in Iran
I. Nasidze et al.
As part of a continuing investigation of the extent to which the genetic and linguistic relationships of populations are correlated, we analyzed mtDNA HV1 sequences, eleven Y chromosome bi-allelic markers, and 9 Y-STR loci in two neighboring groups from the southwest of Iran who speak languages belonging to different families: Indo-European-speaking Bakhtiari, and Semitic-speaking Arabs. Both mtDNA and the Y chromosome, showed a close relatedness of these groups with each other and with neighboring geographic groups, irrespective of the language spoken. Moreover, Semitic-speaking North African groups are more distant genetically from Semitic-speaking groups from the Near East and Iran. Thus, geographical proximity better explains genetic relatedness between populations than does linguistic relatedness in this part of the world.
LinkY chromosomes of Iberian Gypsies
Ann Hum Genet (OnlineEarly Articles).
doi:10.1111/j.1469-1809.2007.00421.x
A Perspective on the History of the Iberian Gypsies Provided by Phylogeographic Analysis of Y-Chromosome Lineages
A. Gusmão et al.
The European Gypsies, commonly referred to as Roma, are represented by a vast number of groups spread across many countries. Although sharing a common origin, the Gypsy groups are highly heterogeneous as a consequence of genetic drift and different levels of admixture with surrounding populations. With this study we aimed at contributing to the knowledge of the Roma history by studying 17 Y-STR and 34 Y-SNP loci in a sample of 126 Portuguese Gypsies. Distinct genetic hallmarks of their past and migration route were detected, namely: an ancestral component, shared by all Roma groups, that reflects their origin in India (H1a-M82; ~17%); an influence from their long permanence in the Balkans/Middle-East region (J2a1b-M67, J2a1b1-M92, I-M170, Q-M242; ~31%); traces of contacts with European populations preceding the entrance in the Iberian Peninsula (R1b1c-M269, J2b1a-M241; ~10%); and a high proportion of admixture with the non-Gypsy population from Iberia (R1b1c-M269, R1-M173/del.M269, J2a-M410, I1b1b-M26, E3b1b-M81; ~37%). Among the Portuguese Gypsies the proportion of introgression from host populations is higher than observed in other groups, a fact which is somewhat unexpected since the arrival of the Roma to Portugal is documented to be more recent than in Central or East Europe.
Link
mtDNA of Slovaks
From the paper:
Ann Hum Genet (OnlineEarly Articles). doi:10.1111/j.1469-1809.2007.00410.x
Mitochondrial DNA Variability in Slovaks, with Application to the Roma Origin
Annals of Human Genetics
A. Malyarchuk, M. A. Perkova, M. V. Derenko, T. Vanecek, J. Lazur, P. Gomolcak
To gain insight into the mitochondrial gene pool diversity of European populations, we studied mitochondrial DNA (mtDNA) variability in 207 subjects from western and eastern areas of Slovakia. Sequencing of two hypervariable segments, HVS I and HVS II, in combination with screening of coding region haplogroup-specific RFLP-markers, revealed that the majority of Slovak mtDNAs belong to the common West Eurasian mitochondrial haplogroups (HV, J, T, U, N1, W, and X). However, a few sub-Saharan African (L2a) mtDNAs were detected in a population from eastern part of Slovakia. In addition, about 3% of mtDNAs from eastern Slovakia encompass Roma-specific lineages. By means of complete mtDNA sequencing we demonstrate here that the Roma-specific M-lineages observed in gene pools of different Slavonic populations (Slovaks, Poles and Russians), belong to Indian-specific haplogroups M5a1 and M35. Moreover, we show that haplogroup J lineages found in gene pools of the Roma and some Slavonic populations (Czechs and Slovaks) belong to new subhaplogroup J1a, which is defined by coding region mutation at position 8460.
Link
Recent mtDNA variability study in Czechs, the neighbors of Slovaks, has shown that they are genetically similar with adjacent European populations, but characterized by a small frequency of East Eurasian (2.8%) and Roma-specific (2.8%) mtDNA lineages (Malyarchuk et al. 2006b). Therefore, the aim of the present study was to characterize the mtDNA variation in Slovaks from western and eastern areas of Slovakia, based on variation of the HVS I and HVS II sequences, followed by a hierarchical survey of mtDNA haplogroup-specific restriction fragments length polymorphism (RFLP) markers.In the above passage they are referring to this paper. More on the haplogroup M in Slovaks:
However, in contrast to the previously studied Czech population from western Bohemia (Malyarchuk et al. 2006b), samples from Slovakia do not display any East Eurasian mtDNAs. One of the Slovak M-haplotype belongs to subhaplogroup M1b and is identical to M1b1a-haplotypes revealed in Italians and Bedouins from southern Israel (Olivieri et al. 2006) as well as in Saudi Arabs (Abu-Amero et al. 2007). A second M-lineage detected in Slovaks is defined by variants at positions 16129–16223-16230–16233-16304–16344. This lineage is identical to those revealed previously in gene pools of the Bulgarian Roma at frequency of 3.6% (Gresham et al. 2001). Based on the presence of the 16129 variant, Gresham et al. (2001) suggested that this lineage belongs to Indian-specific haplogroup M5. Nevertheless, to determine its exact phylogenetic status we completely sequenced our Slovak sample (Slv227) and compared it with Indian M-haplotypes published by Sun et al. (2006) (Fig. 1). As a result, we have found that our sample belongs to haplogroup M35 due to mutations at positions 199 and 12561. Moreover, it shared transition at 15928 with the South Indian sample T17 (from Andhra Pradesh) that allowed us to define a new Indian/Roma branch called as M35b.And on a Roma-related J1* lineage:
Previously, we have found that the Polish Roma population is characterized by high incidence (18.8%) of haplogroup J1* lineage, defined by HVS I motif 16069–16126-16145–16222-16235–16261-16271 (Malyarchuk et al. 2006a). This and a similar haplotype, lacking only the 16271 transition, are very rare in European Roma populations, being found only in the Spanish, Bulgarian and Hungarian Roma (Gresham et al. 2001; Egyed et al. 2007). Among Europeans, such haplotypes have been revealed only in French (0.5%; Dubut et al. 2004), Hungarian (0.5%; Egyed et al. 2007) and Czech (about 3%; Vanecek et al. 2004; Malyarchuk et al. 2006b) populations. In the present study, we have found that 2.9% of individuals from eastern Slovakia are characterized by exactly the same J1*-haplotype.On differences within Slovakia:
The MDS analysis performed on the basis of pairwise FST values revealed that Slovak populations do not cluster together. Western Slovaks are located together with the Czechs and Austrians (in accordance with their geographic proximity), whereas eastern Slovaks are placed close to Slovenians (Fig. 3).
Ann Hum Genet (OnlineEarly Articles). doi:10.1111/j.1469-1809.2007.00410.x
Mitochondrial DNA Variability in Slovaks, with Application to the Roma Origin
Annals of Human Genetics
A. Malyarchuk, M. A. Perkova, M. V. Derenko, T. Vanecek, J. Lazur, P. Gomolcak
To gain insight into the mitochondrial gene pool diversity of European populations, we studied mitochondrial DNA (mtDNA) variability in 207 subjects from western and eastern areas of Slovakia. Sequencing of two hypervariable segments, HVS I and HVS II, in combination with screening of coding region haplogroup-specific RFLP-markers, revealed that the majority of Slovak mtDNAs belong to the common West Eurasian mitochondrial haplogroups (HV, J, T, U, N1, W, and X). However, a few sub-Saharan African (L2a) mtDNAs were detected in a population from eastern part of Slovakia. In addition, about 3% of mtDNAs from eastern Slovakia encompass Roma-specific lineages. By means of complete mtDNA sequencing we demonstrate here that the Roma-specific M-lineages observed in gene pools of different Slavonic populations (Slovaks, Poles and Russians), belong to Indian-specific haplogroups M5a1 and M35. Moreover, we show that haplogroup J lineages found in gene pools of the Roma and some Slavonic populations (Czechs and Slovaks) belong to new subhaplogroup J1a, which is defined by coding region mutation at position 8460.
Link
January 13, 2008
Andaman islanders: relic of early Asians or more recent migrants?
Am J Phys Anthropol. 2008 Jan 10 [Epub ahead of print]
Detailed mtDNA genotypes permit a reassessment of the settlement and population structure of the Andaman Islands.
Barik SS, Sahani R, Prasad BV, Endicott P, Metspalu M, Sarkar BN, Bhattacharya S, Annapoorna PC, Sreenath J, Sun D, Sanchez JJ, Ho SY, Chandrasekar A, Rao VR.
Anthropological Survey of India, 27 Jawaharlal Nehru Road, Kolkata 700 016, India.
The population genetics of the Indian subcontinent is central to understanding early human prehistory due to its strategic location on the proposed corridor of human movement from Africa to Australia during the late Pleistocene. Previous genetic research using mtDNA has emphasized the relative isolation of the late Pleistocene colonizers, and the physically isolated Andaman Island populations of Island South-East Asia remain the source of claims supporting an early split between the populations that formed the patchy settlement pattern along the coast of the Indian Ocean. Using whole-genome sequencing, combined with multiplexed SNP typing, this study investigates the deep structure of mtDNA haplogroups M31 and M32 in India and the Andaman Islands. The identification of a so far unnoticed rare polymorphism shared between these two lineages suggests that they are actually sister groups within a single haplogroup, M31'32. The enhanced resolution of M31 allows for the inference of a more recent colonization of the Andaman Islands than previously suggested, but cannot reject the very early peopling scenario. We further demonstrate a widespread overlap of mtDNA and cultural markers between the two major language groups of the Andaman archipelago. Given the "completeness" of the genealogy based on whole genome sequences, and the multiple scenarios for the peopling of the Andaman Islands sustained by this inferred genealogy, our study hints that further mtDNA based phylogeographic studies are unlikely to unequivocally support any one of these possibilities.
Link
January 11, 2008
Sexual orientation correlated with blood type but not with hair or eye color
Arch Sex Behav. 2007 Dec 12 [Epub ahead of print]
Eye Color, Hair Color, Blood Type, and the Rhesus Factor: Exploring Possible Genetic Links to Sexual Orientation.
Ellis L, Ficek C, Burke D, Das S.
Department of Sociology, Minot State University, Minot, ND, 58707, USA, lee.ellis@minotstateu.edu.
The present study sought to expand the limited evidence that sexual orientation is influenced by genetic factors. This was accomplished by seeking statistical differences between heterosexuals and homosexuals for four traits that are known to be genetically determined: eye color, natural hair color, blood type, and the Rhesus factor. Using a sample of over 7,000 U.S. and Canadian college students supplemented with additional homosexual subjects obtained through internet contacts, we found no significant differences between heterosexuals and homosexuals regarding eye color or hair color. In the case of blood type and the Rh factor, however, interesting patterns emerged. Heterosexual males and females exhibited statistically identical frequencies of the A blood type, while gay men exhibited a relatively low incidence and lesbians had a relatively high incidence (p < .05). In the case of the Rh factor, unusually high proportions of homosexuals of both sexes were Rh- when compared to heterosexuals (p < .06). The findings suggest that a connection may exist between sexual orientation and genes both on chromosome 9 (where blood type is determined) and on chromosome 1 (where the Rh factor is regulated).
Link
Sardinian Y chromosomes
The open access journal PLoS One has an article on the Y chromosomes of Sardinians.
PLoS ONE. 2008 Jan 9;3(1):e1430.
Y-chromosome based evidence for pre-neolithic origin of the genetically homogeneous but diverse sardinian population: inference for association scans.
Contu D, Morelli L, Santoni F, Foster JW, Francalacci P, Cucca F.
Laboratorio di Immunogenetica, Ospedale Microcitemico, Cagliari, Italy.
The island of Sardinia shows a unique high incidence of several autoimmune diseases with multifactorial inheritance, particularly type 1 diabetes and multiple sclerosis. The prior knowledge of the genetic structure of this population is fundamental to establish the optimal design for association studies in these diseases. Previous work suggested that the Sardinians are a relatively homogenous population, but some reports were contradictory and data were largely based on variants subject to selection. For an unbiased assessment of genetic structure, we studied a combination of neutral Y-chromosome variants, 21 biallelic and 8 short tandem repeats (STRs) in 930 Sardinian males. We found a high degree of interindividual variation but a homogenous distribution of the detected variability in samples from three separate regions of the island. One haplogroup, I-M26, is rare or absent outside Sardinia and is very common (0.37 frequency) throughout the island, consistent with a founder effect. A Bayesian full likelihood analysis (BATWING) indicated that the time from the most recent common ancestor (TMRCA) of I-M26, was 21.0 (16.0-25.5) thousand years ago (KYA) and that the population began to expand 14.0 (7.8-22.0) KYA. These results suggest a largely pre-Neolithic settlement of the island with little subsequent gene flow from outside populations. Consequently, Sardinia is an especially attractive venue for case-control genome wide association scans in common multifactorial diseases. Concomitantly, the high degree of interindividual variation in the current population facilitates fine mapping efforts to pinpoint the aetiologic polymorphisms.
Link
January 10, 2008
Polynesians more Asian than Melanesian
Of interest is that the racial ancestry of Polynesians as evidenced by genomic analysis is different from the expected one based on uniparentally transmitted markers (on mtDNA and the Y chromosome). Nonetheless, the discrepancy is small enough to validate the use of such markers as a first-order approximation of a people's racial ancestry.
The American Journal of Human Genetics, Volume 82, Issue 1, 194-198, 10 January 2008
Genome-wide Analysis Indicates More Asian than Melanesian Ancestry of Polynesians
Manfred Kayser et al.
Abstract
Analyses of mitochondrial DNA (mtDNA) and nonrecombining Y chromosome (NRY) variation in the same populations are sometimes concordant but sometimes discordant. Perhaps the most dramatic example known of the latter concerns Polynesians, in which about 94% of Polynesian mtDNAs are of East Asian origin, while about 66% of Polynesian Y chromosomes are of Melanesian origin. Here we analyze on a genome-wide scale, to our knowledge for the first time, the origins of the autosomal gene pool of Polynesians by screening 377 autosomal short tandem repeat (STR) loci in 47 Pacific Islanders and compare the results with those obtained from 44 Chinese and 24 individuals from Papua New Guinea. Our data indicate that on average about 79% of the Polynesian autosomal gene pool is of East Asian origin and 21% is of Melanesian origin. The genetic data thus suggest a dual origin of Polynesians with a high East Asian but also considerable Melanesian component, reflecting sex-biased admixture in Polynesian history in agreement with the Slow Boat model. More generally, these results also demonstrate that conclusions based solely on uniparental markers, which are frequently used in population history studies, may not accurately reflect the history of the autosomal gene pool of a population.
Link
Edward O. Wilson changes mind on group selection
A Sunday Times article, We're not as selfish as we think, outlines pretty well Wilson's new conclusions regarding the evolution of altruism. An excerpt:
The first answer, proposed by the great British biologist William Hamilton and popularised by Dawkins in his book The Selfish Gene, is “kin selection”. Genes exist to replicate themselves. This is ideally done by ensuring that the individual reproduces. But it might also be done by ensuring that relatives of the individual reproduce because they share many of the same genes. So altruism starts with family members. Altruism towards strangers, meanwhile, is explained by game theory - computer models show that a cautiously benign approach to strangers is the best evolutionary strategy. Either way, Dawkins’s “selfish gene” is at the heart of the whole process.
...
“Kin selection was a very seductive idea,” Wilson explains, “and I promoted it heavily in my books in the 1970s. Unfortunately it has produced a little industry with its own mathematical models. It hasn’t produced much else and, meanwhile, sociobiology has flourished.”
...“We are united in our view of group selection,” the Wilsons [E.O. and David Sloan Wilson] concluded, “which we converged upon through separate lines of inquiry.” Group selection says that evolution acts on many levels. Take the ants again. “They are constantly at war,” says Wilson. “Give ants nuclear weapons and the world would be destroyed in a week.”
Warring ants will be better off if the entire fitness of the colony can be improved. If it is improved then the methods of that colony will be successful in war and the genes that carried the improvement will be disseminated to a wider ant population. Kin selection may play a part within the colony. But group selection is the far more potent evolutionary force. In his next book Wilson is to study the implications of this new paradigm for humans. Knowing him, it may well turn out to be the first great scientific statement of the 21st century.
From a EurekAlert release:
Eusociality is a challenge for biologists to understand because worker castes in eusocial species forgo individual reproduction but rear young that are not their own, a behavior that biologists label altruistic. Wilson’s current view about eusociality differs from the assessment in his seminal book Sociobiology: The New Synthesis (1975). According to that widely accepted earlier account, selection acting on individuals that are related (kin selection), rather than on whole colonies, explains eusociality in Hymenoptera. Kin selection is thought to be especially powerful in these animals because of an unusual genetic system, known as haplodiploidy, that they share.
Wilson’s survey in BioScience, which examines the findings of a number of researchers, points out aspects of the occurrence of eusociality that the standard explanation has difficulty accounting for. Eusociality has evolved only a few times, and not all of them were in haplodiploid species. Furthermore, the great majority of haplodiploid species are not eusocial. Wilson holds that selection acting on traits that emerge at a group level provides a more complete explanation for eusociality’s rare instances than kin selection. Kin selection is, he writes, “not wrong” but incomplete.
January 09, 2008
Russian Y chromosomes
An important new paper on Y chromosome variation in Russians will soon appear in AJHG. I have not seen the full article posted on the website yet, so more to follow.
UPDATE (Jan 10):
While previous work on the Y chromosomes of Russians had established the main conclusions (dominance of Y-haplogroup R1a, and a Finno-Ugrian N3 substratum), this paper adds to our understanding by examinining several ethnic Russian populations and placing their variation within the larger Eurasian context.
An interesting multi-dimensional scaling plot from the paper. For each ethnic group, the large disk indicates the entire group, while the smaller figures, geographical subpopulations. This is an interesting way to present the information, and shows clearly (a) the tight clustering of Slavic populations in a large area from Poland to Russia and the Ukraine, and also the evidence of the Russification of indigenous Finno-Ugrians (populations 1-4: Mezen, Pinega, Krasnoborsk, Vologda).
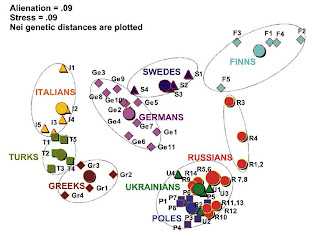
Also of interest for students of Slavic origins, another recent article about which I had blogged here. Note also the distance between all Greek subpopulations, including Macedonian Greeks from the Slavic cluster which should be read as further evidence contra the Fallmerayer thesis.
The Greek, Turkish, and Italian populations are well separated from the northern and eastern European populations on the left side of the figure; Germans are intermediate between southern Europeans and Swedes who tend to the Finns; like the northern Russians, Swedes also have their own Finnish influence. Evident, also, is the differentiation between Slavs and Germans, which had been noted before.
Also of interest from the paper is the comparison of inter-ethnic variation within European ethnic groups (also evident in the Figure):
Am J Hum Genet. 2008 Jan;82(1):236-50.
Two sources of the Russian patrilineal heritage in their eurasian context.
Balanovsky O, Rootsi S, Pshenichnov A, Kivisild T, Churnosov M, Evseeva I, Pocheshkhova E, Boldyreva M, Yankovsky N, Balanovska E, Villems R.
Progress in the mapping of population genetic substructure provides a core source of data for the reconstruction of the demographic history of our species and for the discovery of common signals relevant to disease research: These two aspects of enquiry overlap in their empirical data content and are especially informative at continental and subcontinental levels. In the present study of the variation of the Y chromosome pool of ethnic Russians, we show that the patrilineages within the pre-Ivan the Terrible historic borders of Russia have two main distinct sources. One of these antedates the linguistic split between West and East Slavonic-speaking people and is common for the two groups; the other is genetically highlighted by the pre-eminence of haplogroup (hg) N3 and is most parsimoniously explained by extensive assimilation of (or language change in) northeastern indigenous Finno-Ugric tribes. Although hg N3 is common for both East European and Siberian Y chromosomes, other typically Siberian or Mongolian hgs (Q and C) have negligible influence within the studied Russian Y chromosome pool. The distribution of all frequent Y chromosome haplogroups (which account for 95% of the Y chromosomal spectrum in Russians) follows a similar north-south clinal pattern among autosomal markers, apparent from synthetic maps. Multidimensional scaling (MDS) plots comparing intra ethnic and interethnic variation of Y chromosome in Europe show that although well detectable, intraethnic variation signals do not cross interethnic borders, except between Poles, Ukrainians, and central-southern Russians, thereby revealing their overwhelmingly shared patrilineal ancestry.
Link
UPDATE (Jan 10):
While previous work on the Y chromosomes of Russians had established the main conclusions (dominance of Y-haplogroup R1a, and a Finno-Ugrian N3 substratum), this paper adds to our understanding by examinining several ethnic Russian populations and placing their variation within the larger Eurasian context.
An interesting multi-dimensional scaling plot from the paper. For each ethnic group, the large disk indicates the entire group, while the smaller figures, geographical subpopulations. This is an interesting way to present the information, and shows clearly (a) the tight clustering of Slavic populations in a large area from Poland to Russia and the Ukraine, and also the evidence of the Russification of indigenous Finno-Ugrians (populations 1-4: Mezen, Pinega, Krasnoborsk, Vologda).

Also of interest for students of Slavic origins, another recent article about which I had blogged here. Note also the distance between all Greek subpopulations, including Macedonian Greeks from the Slavic cluster which should be read as further evidence contra the Fallmerayer thesis.
The Greek, Turkish, and Italian populations are well separated from the northern and eastern European populations on the left side of the figure; Germans are intermediate between southern Europeans and Swedes who tend to the Finns; like the northern Russians, Swedes also have their own Finnish influence. Evident, also, is the differentiation between Slavs and Germans, which had been noted before.
Also of interest from the paper is the comparison of inter-ethnic variation within European ethnic groups (also evident in the Figure):
Table 3 summarizes data on Y chromosomal intraethnic variation among Russians and compares them with other ethnicities of Europe. The highest variation among subpopulations is found for Finns, Croatians, Russians, and Italians (GST value between 0.04 and 0.08); Swedes and Germans demonstrate moderate variation; other ethnic groups (Greeks, Turks, Poles, Belorussians, and Ukrainians) exhibit similar and lower level of regional variation (GST value approximately 0.01).
Am J Hum Genet. 2008 Jan;82(1):236-50.
Two sources of the Russian patrilineal heritage in their eurasian context.
Balanovsky O, Rootsi S, Pshenichnov A, Kivisild T, Churnosov M, Evseeva I, Pocheshkhova E, Boldyreva M, Yankovsky N, Balanovska E, Villems R.
Progress in the mapping of population genetic substructure provides a core source of data for the reconstruction of the demographic history of our species and for the discovery of common signals relevant to disease research: These two aspects of enquiry overlap in their empirical data content and are especially informative at continental and subcontinental levels. In the present study of the variation of the Y chromosome pool of ethnic Russians, we show that the patrilineages within the pre-Ivan the Terrible historic borders of Russia have two main distinct sources. One of these antedates the linguistic split between West and East Slavonic-speaking people and is common for the two groups; the other is genetically highlighted by the pre-eminence of haplogroup (hg) N3 and is most parsimoniously explained by extensive assimilation of (or language change in) northeastern indigenous Finno-Ugric tribes. Although hg N3 is common for both East European and Siberian Y chromosomes, other typically Siberian or Mongolian hgs (Q and C) have negligible influence within the studied Russian Y chromosome pool. The distribution of all frequent Y chromosome haplogroups (which account for 95% of the Y chromosomal spectrum in Russians) follows a similar north-south clinal pattern among autosomal markers, apparent from synthetic maps. Multidimensional scaling (MDS) plots comparing intra ethnic and interethnic variation of Y chromosome in Europe show that although well detectable, intraethnic variation signals do not cross interethnic borders, except between Poles, Ukrainians, and central-southern Russians, thereby revealing their overwhelmingly shared patrilineal ancestry.
Link
January 08, 2008
January 05, 2008
Critique of Stephen Marquardt's Beauty Mask
See the Human Beauty and You and the Mask sites for more information on the Beauty Mask.
Aesthetic Plast Surg. 2008 Jan 4;
Marquardt's Phi Mask: Pitfalls of Relying on Fashion Models and the Golden Ratio to Describe a Beautiful Face.
Holland E
BACKGROUND: Stephen Marquardt has derived a mask from the golden ratio that he claims represents the "ideal" facial archetype. Many have found his mask convincing, including cosmetic surgeons. However, Marquardt's mask is associated with numerous problems. The method used to examine goodness of fit with the proportions in the mask is faulty. The mask is ill-suited for non-European populations, especially sub-Saharan Africans and East Asians. The mask also appears to approximate the face shape of masculinized European women. Given that the general public strongly and overwhelmingly prefers above average facial femininity in women, white women seeking aesthetic facial surgery would be ill-advised to aim toward a better fit with Marquardt's mask. This article aims to show the proper way of assessing goodness of fit with Marquardt's mask, to address the shape of the mask as it pertains to masculinity-femininity, and to discuss the broader issue of an objective assessment of facial attractiveness. METHODS: Generalized Procrustes analysis is used to show how goodness of fit with Marquardt's mask can be assessed. Thin-plate spline analysis is used to illustrate visually how sample faces, including northwestern European averages, differ from Marquardt's mask. RESULTS: Marquardt's mask best describes the facial proportions of masculinized white women as seen in fashion models. CONCLUSIONS: Marquardt's mask does not appear to describe "ideal" face shape even for white women because its proportions are inconsistent with the optimal preferences of most people, especially with regard to femininity.
Link
Abstract on Y-haplogroup J1-M267
From the XVII Congresso Degli Antropologi Italiani (thanks to the reader who brought this to my attention).
Dispersal patterns of M267-derived Y chromosomes in the Mediterranean
Sergio Tofanelli (1), Gianmarco Ferri (2), Laura Caciagli (1), Luca Taglioli (1), Donata Luiselli (3), Giorgio Paoli (1), Cristian Capelli (4)
Human Y chromosomes belonging to haplogroup J1 (International Society of Genetic Genealogy 2007) share a derived state (G) at the M267 mutation site. It has been argued (Semino et al., 2004) that this mutation originated some 24,000 years ago in the Near East or North-East Africa and spread in the Mediterranean by means of at least two temporally distinct migrations: the first would have occurred towards Aegean and Italian coasts in Neolithic times; a more recent one (estimated time bounds 8.7–4.3 Ky) would have diffuse M267-G in Northern Africa. According to other authors (Nebel et al., 2001; Al-Zahery et al., 2003; Di Giacomo et al., 2004), however, M267-G would have arisen as early as 10,000 years ago and would mark the historical expansion of Arabian tribes in the northern Levant and southern Africa.
We investigated the variability of M267-G chromosomes from 23 different Mediterranean populations (original and published data) at a total of 20 Y STR loci. Three different sets of markers were considered: the “Y-filer” set (DYS456, DYS389I, DYS390, DYS389II, DYS458, DYS19, DYS385a, DYS385b, DYS393, DYS391, DYS439, DYS635, YGATA-H4, DYS437, DYS392, DYS438, DYS448) allowed to more accurately reconstruct time and space of the main dispersal events associated with this mutation; the “MH” (DYS19, DYS388, DYS390, DYS391, DYS392, DYS393) and the “DL3” (DYS388, YCAIIa, YCAIIb) sets allowed the origin and diffusion of local modal haplotypes to be better defined.
The results depict a more complex and deeper stratification of haplotype-clades than thought before. In fact, we could observe both, geographically structured and even lineages, that could be associated to pre-agricultural, Neolithic and historical demographic events.
January 04, 2008
mtDNA of Basques
Am J Hum Biol. 2008 Jan 2 [Epub ahead of print]
Mitochondrial DNA haplogroup diversity in Basques: A reassessment based on HVI and HVII polymorphisms.
Alfonso-Sánchez MA et al.
This study provides a more complete characterization of the mitochondrial genome variability of the Basques, including data on the hypervariable segment HVII of the D-loop region, which remains relatively unknown. To that end, genomic DNA from 55 healthy men living in the Arratia Valley (Biscay province) and the Goiherri region (Guipúzcoa province) was examined by direct sequencing. Three-generation pedigree charts were compiled to ensure the collection from autochthonous individuals. The most notable findings emerging from the analysis of haplogroup composition are: (i) lack of U8a mitochondrial lineage, a rare subhaplogroup recently identified in Basques and proposed as a Paleolithic marker, (ii) low frequency of haplogroup V, which conflicts with results of earlier analyses describing high frequencies in southwestern Europe, and (iii) high frequency of haplogroup J, especially subhaplogroups J1c1 and J2a. The frequency of haplogroup J does not coincide with previous mtDNA studies in present-day Basques, but is congruent with frequencies found in prehistoric and historic Basque populations. In explaining divergence in haplogroup composition between modern Basque samples, we hypothesized spatial heterogeneity promoted by population fragmentation due to extreme limitation of dispersal opportunities during the Pleistocene glaciations. Similarities between extinct and extant Basque populations as for the high frequency of lineage J, as well as the abundance of this haplogroup in northern Spain endorse a shift in the focus of attention of mtDNA analysts. A refined dissection of haplogroup J might provide more solid evidence about the process of postglacial recolonization of Europe, and thus about the shaping of the European gene pool.
Link
Subscribe to:
Posts (Atom)